
As discussed in my previous post, I thought it would be useful to see how crime in Hemel and Dacorum compared with other key towns in Hertfordshire. For this part of the study I chose St Albans, Hatfield, Welwyn, Watford and Stevenage.
I wanted also to see if the crime numbers reported by the police were static over time (unlikely), and if there was a trend of higher or lower criminal events.
There is a small problem with this study – does a rising number indicate a higher number of crimes, or simply that the police are more efficient in responding and reporting such events ? That’s a question we need to ask our police commissioner, and our MP.
Let’s start with a view of the Index of Multiple Deprivation over the towns in the study:
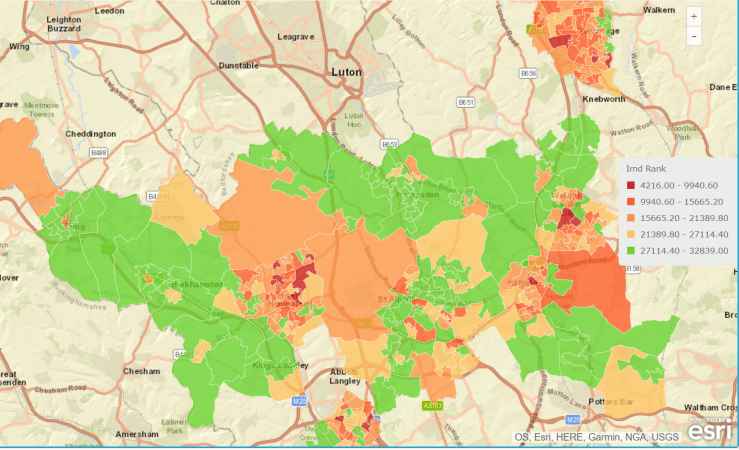
No real surprises here, areas of most towns are highly deprived (St Albans less so) and countryside areas show the least deprivation.
Now we look at the incidence of certain crime types in February 2017:
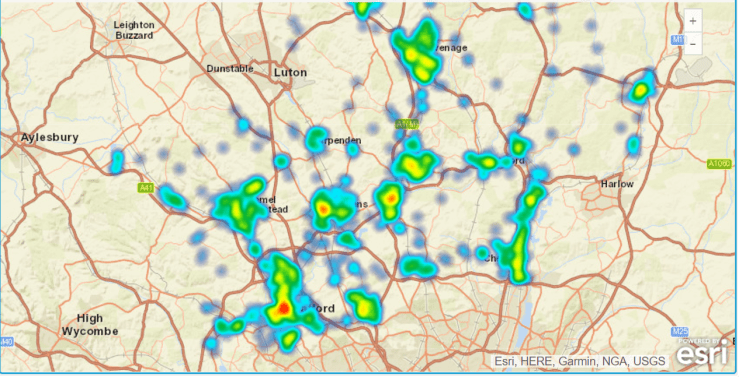
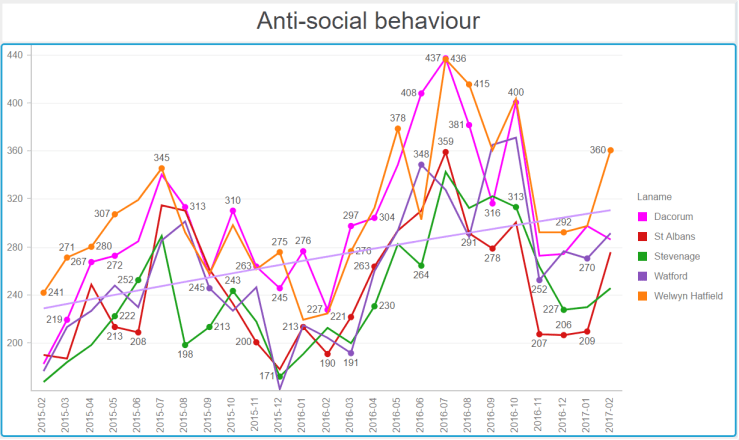
In February 2017, Watford, St Albans and Hatfield had a higher concentration of antisocial behaviour.
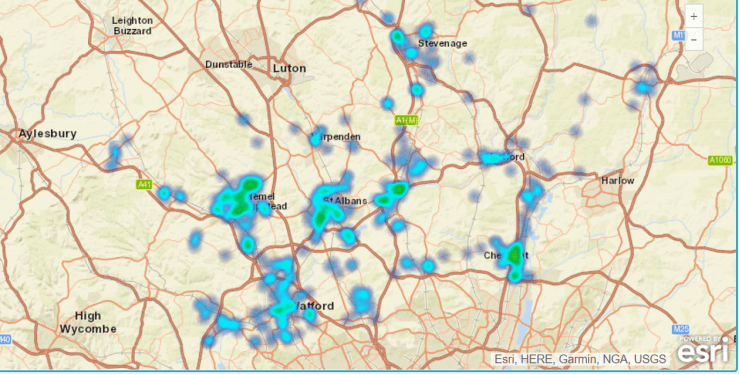
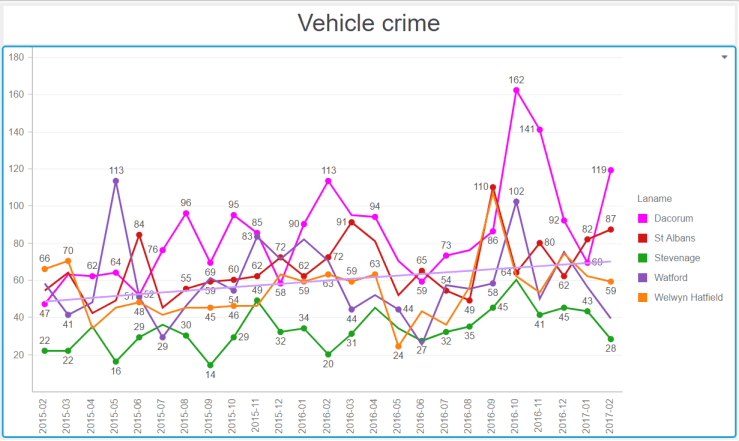
Hemel Hempstead has a higher incidence of vehicle crime.

Watford and Hemel are top of the league…
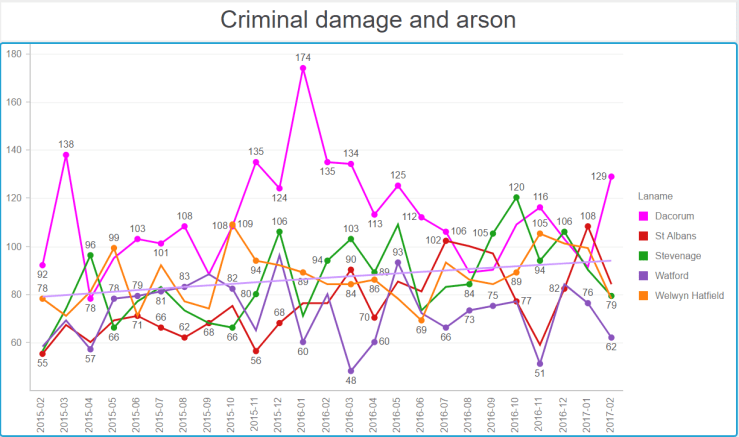
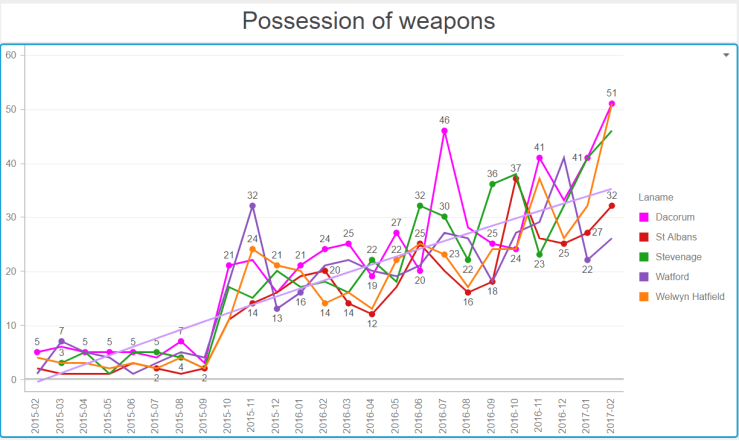
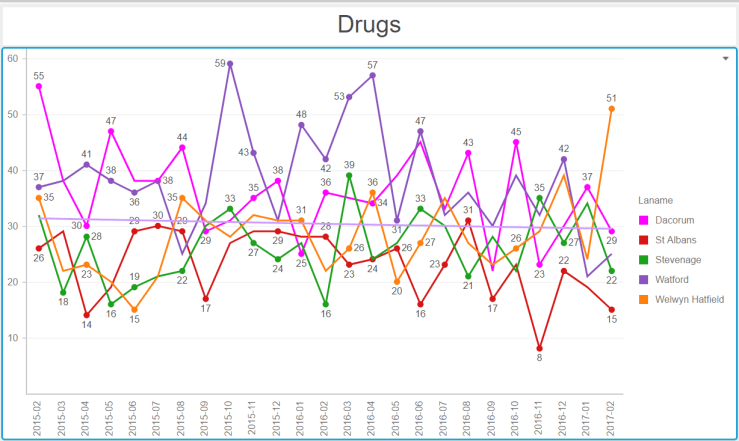
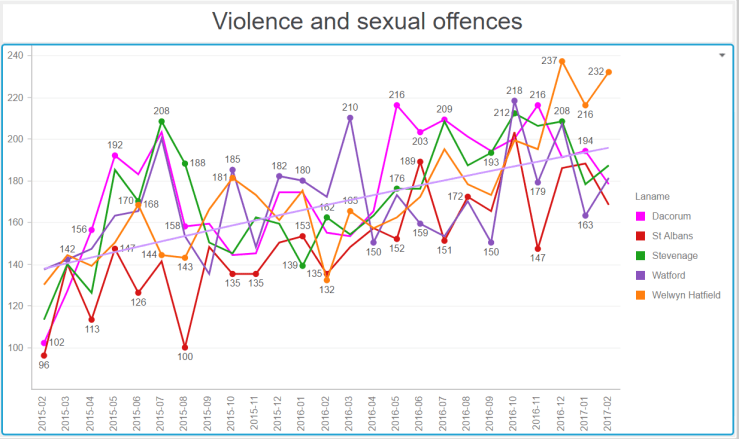
Now the series of graphs below require some explanation. They show, for number of big towns in Hertfordshire, the crime numbers by category over 24 months (February 2015 to February 2017). To help put our town in perspective, I have represented the line for Hemel in shocking pink. The horizontal line on each graph shows the general trend over time. They all go up…
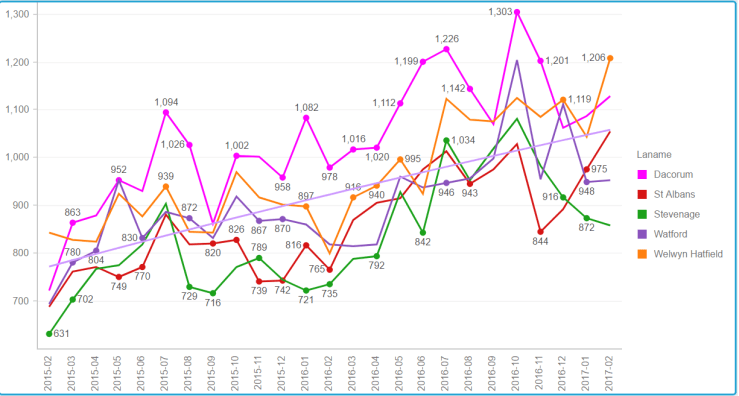
Alarmingly, Hemel seems to be at the high mark for the total number of crimes.
And there you have it. In almost all towns, we have increasing crime numbers in all categories being reported by the police. What does this mean ? Does this mean the police are more efficient at detecting and reporting crime ?
Crime affects us all – I wonder what our MPs have to say about this ? Why is it on the increase?

You must be logged in to post a comment.