
I happen to be, on Facebook, member of two groups: One about Brighton, where I first arrived in the UK in 1984, and one about Hemel Hempstead, the town where I have lived since 1993. You could not think of two more different places. Brighton is lefty, deprived and interesting, whilst Hemel is quite conservative, relatively affluent and hard-working.
The Facebook pages reflect this. On the Hemel one, people are regularly complaining about bikes and scooters being stolen, along with regularly heated debates between the Conservative, DailyMaily, Flog’em and Hang’em members and the small but resolute core of Left-leaning, liberal people. It’s a great way of looking beyond your ‘bubble’.
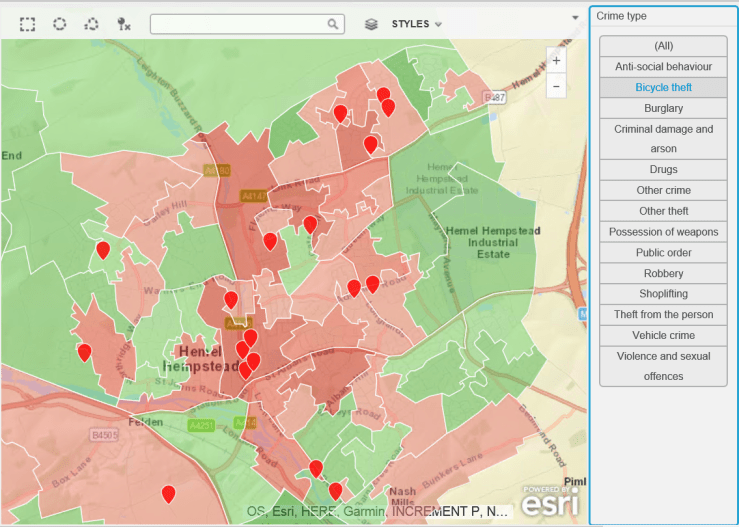
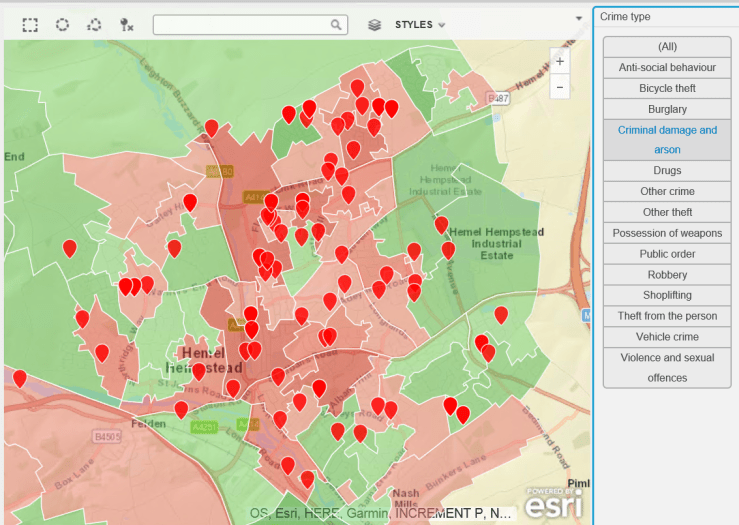
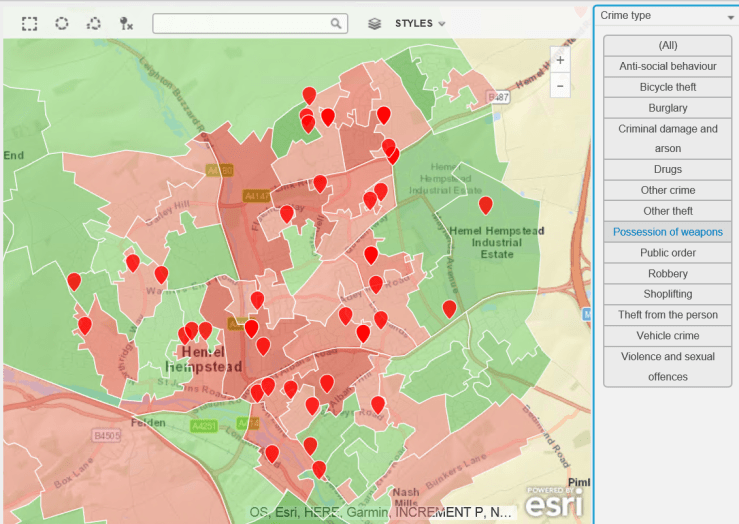
The rather frequent complaints about bike thefts led me to procure some crime data – a great repository of this exists at data.police.uk, so i thought it would be useful to plot this on a map and see if there is a problem with bike theft in my hard-working, nuttily conservative town. As a background canvas, I am using deprivation data to identify areas which are more or less subject to crime, according to the Index of Multiple Deprivation data for 2015, which can be found here.
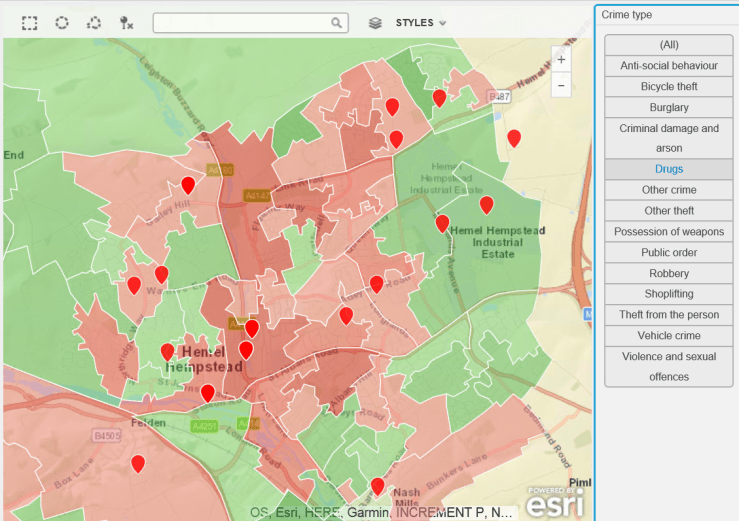
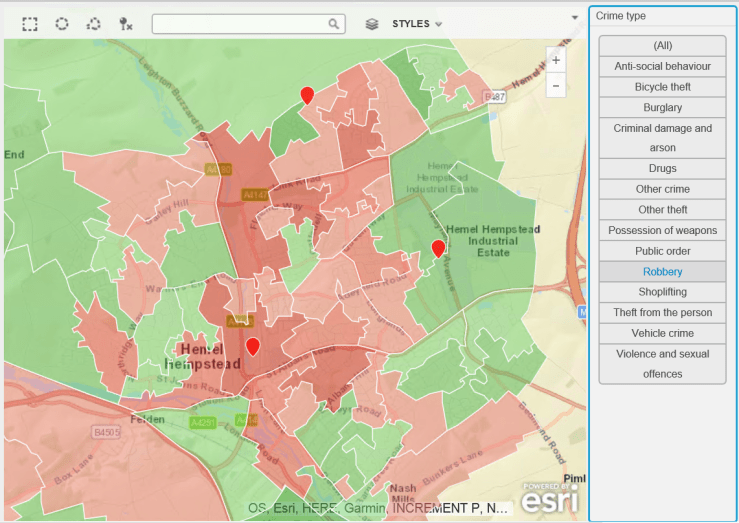
The data is for February 2017. The background deprivation colour scheme goes from green (no big issue with crime) to red (rather more crime).
Do you think bike theft is Hemel Hempstead’s biggest crime issue ? Let’s see…
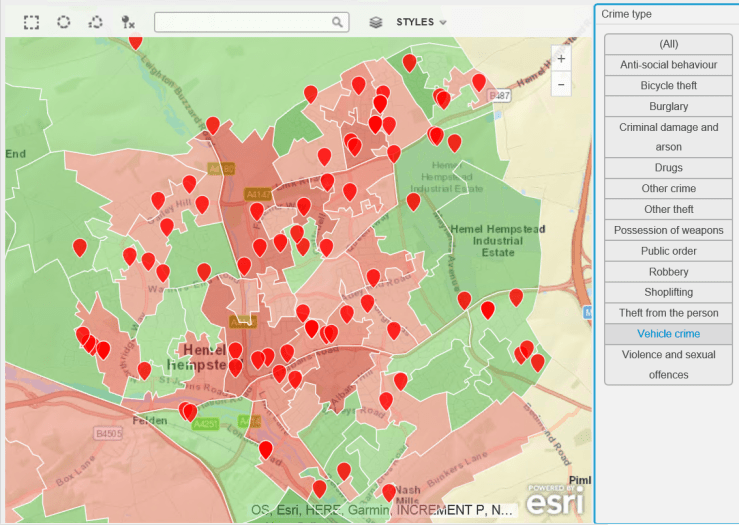

And there you have it – a snapshot of the criminal landscape in the town where I live. As usual with such investigations, many questions arise:
- How does that look plotted over time ? (I have the data, watch this space).
- What does my MP think about it ?
- Why are there clusters of violence in certain residential areas ?
- How does my town compare to other similar towns ?
- How does the police cope with this workload ? It’s a lot of crime…
Finally, should this be an election issue for the people of Hemel Hempstead ? According to the Facebook page and the local paper, it’s all about bad parking, bike thefts and foxes in gardens.
More maps and questions to come, I think.
(Commercial Message 🙂 )
I have used, as promised, the excellent map layers feature of MicroStrategy 10.7. The background deprivation layer is based on Local Super Output Area (Census sub-division) shapefile, the crime layer uses the February 2017 data from the Hertfordshire Constabulary).

You must be logged in to post a comment.