

I have played Euromillions for many years. It’s been an effective way of turning money into nothing, and I can only justify it by the warm feeling that I am contributing to good causes. I have won something many times, mostly single digits… But one day, maybe, I could win a life-changing jackpot. Which I will not win if I don’t play.
Up until now, I have never really thought about numbers I have played. I vaguely know that you have as many chances of winning using the Lucky Dip method as you do with a careful selection of numbers. It’s also said that you have more chances of being struck by lightning. And then, there’s the Gambler’s Fallacy:
The gambler’s fallacy, also known as the Monte Carlo fallacy or the fallacy of the maturity of chances, is the incorrect belief that, if a particular event occurs more frequently than normal during the past, it is less likely to happen in the future (or vice versa), when it has otherwise been established that the probability of such events does not depend on what has happened in the past. Such events, having the quality of historical independence, are referred to as statistically independent. The fallacy is commonly associated with gambling, where it may be believed, for example, that the next dice roll is more than usually likely to be six because there have recently been fewer than the expected number of sixes.
https://en.wikipedia.org/wiki/Gambler%27s_fallacy
But still, I wonder if there is a way of picking numbers, a pattern that would make me more likely to win the jackpot ? The Gambler’s Fallacy says there isn’t a way. It would be interesting to research this, however, by getting hold of the draw history and analysing it.
Finding the draw history
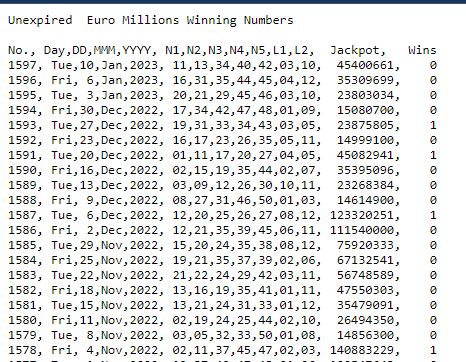
The official National Lottery site lets you download draw history, but not in a form that’s easily consumable. I have found this site:
which provides data in this format:
I can copy and paste this data into a spreadsheet:
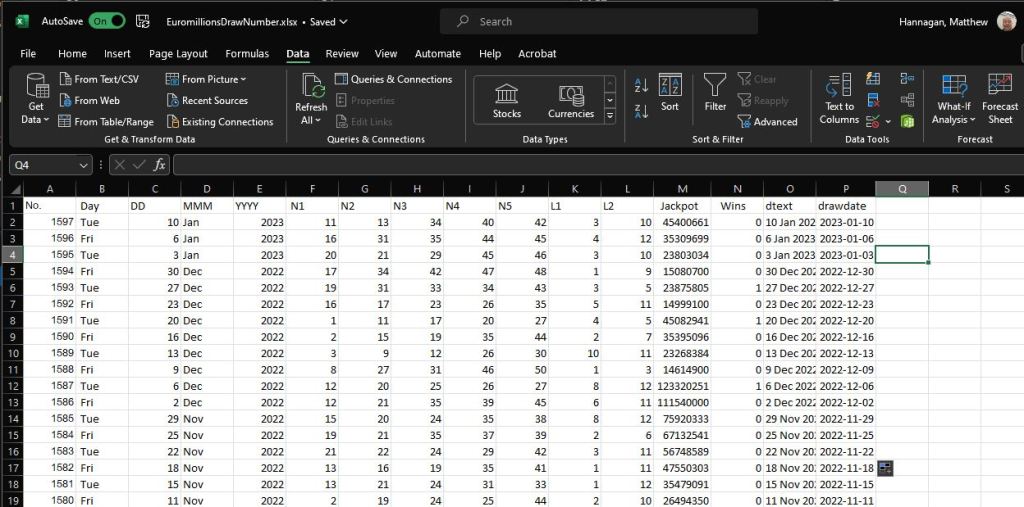
Which I then import into MicroStrategy:
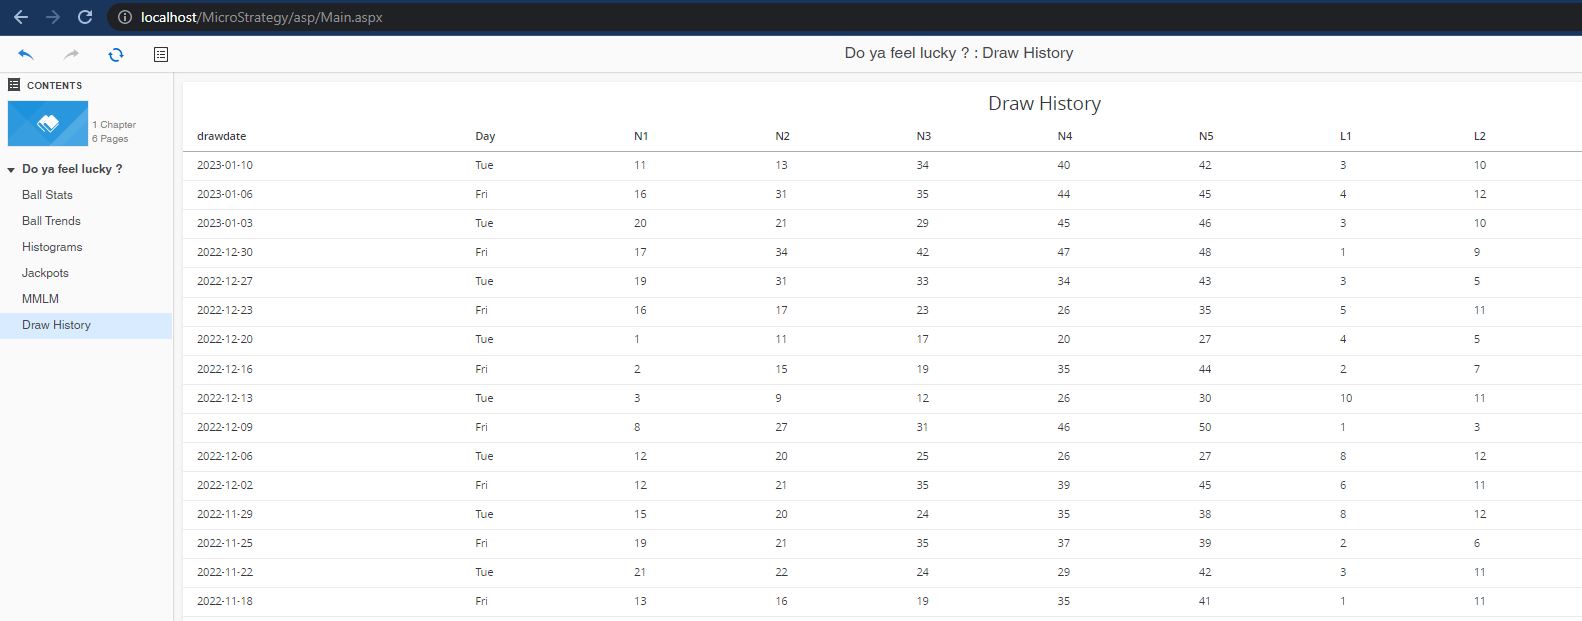
I now have a dataset in a form suitable for analysis. A draw consists of five numbers (N1 to N5) with values ranging from 1 to 50, and two additional numbers (L1 and L2) ranging from 1 to 12. Each row represents a draw, and is identified by its draw date. We have also the day of the week on which the draw occurred.
Visualisations
Ball Stats
This is a classical way of showing data, looking at each ball in isolation, with a trend for the ball value over time.


Click on the images to view in full screen.
This is not really providing guidance. You can see that for each ball, over time, there is no predictable pattern. This visualisation is not helping me pick numbers, so far.
Ball Trends
A slightly different treatment, with a more visible timeline of ball values over time:


This helps a bit more, in that you can get a ‘feel’, for each ball, of values that seem to occur more than others… with absolutely no rational, scientific or statistical validity.
Histograms !
Now you’re talking… This seems to suggest the best value to pick for each ball.

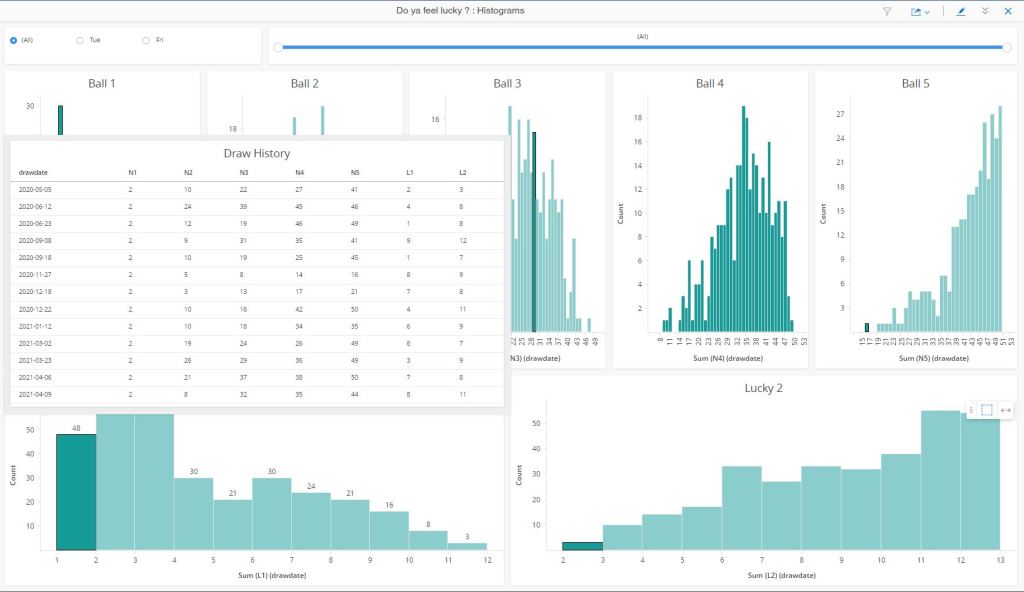
And this where I had an interesting insight: What if there was a relationship between the value of one ball versus another ? This though occurred to me when, using an info window, I clicked on the value 2 of the histogram for ball number 1, I noticed that ball number 2 had the value 10 repeating on more than one line. Exciting !
But how to visualise this in MicroStrategy ?
Sankey to the rescue
Sankey diagrams confuse me, because I have struggled to find a use case for them that didn’t require some serious thought to interpret. But in this instance, it was the perfect method to visualise the relationship between a pair of numbers repeating across the set of (n1,n2,n3,n4,n5,l1,l2).
And there, magic seemed to happen:

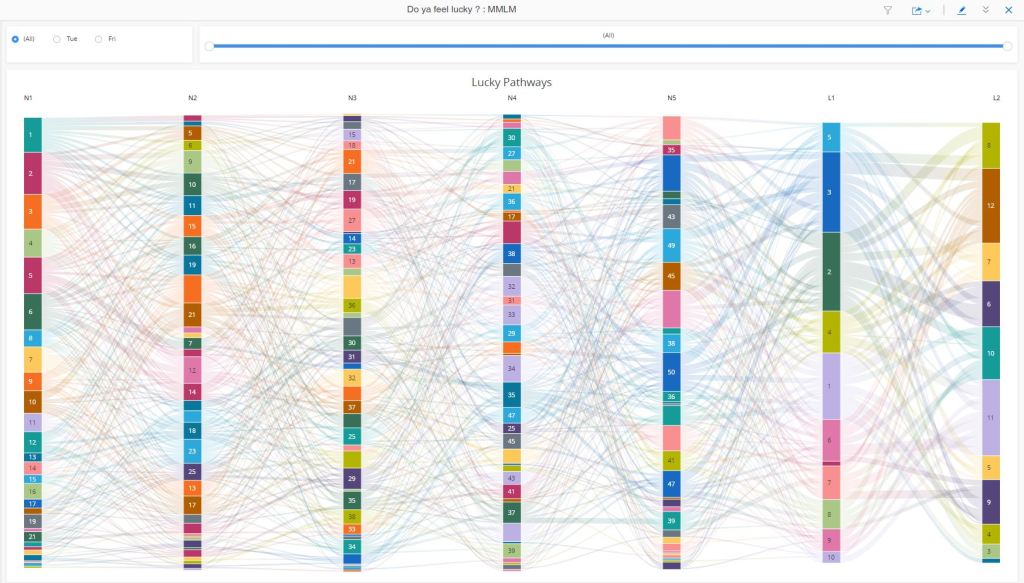
But not quite in the way I intended. The first image shows the Sankey across a limited set of draws. In this, there are clear pathways from one number to another… so picking these should make me more likely to win, if it weren’t for that damned Gambler’s Fallacy. Another way of interpreting the Fallacy is that the lottery is a system without a memory – it does not remember, or is not influenced, by what has happened before. What happened in the past is irrelevant,
This is demonstrated by the second picture, which is using a far greater set of draws. You can see the lines linking one number to another are much thinner, and that over time, any visible, distinct pathways should disappear altogether.
Is this beyond hope ?
When it comes to predicting, or even selecting lottery numbers, then it’s pretty much impossible. It’s a physical system, so even if you had the same machine and the same set of balls (it’s not the case, many machines and many ball sets are used in many permutations) that would somehow develop a bias over time, you’d only get a reduction in the odds, still astronomical. So you’d be more likely to guess the numbers, but only more likely.
Other games of chance have better odds, and can be beaten. There are a good number of texts and books out there on the subject.
For me, though, I am happy that I have managed to get my head around the Gambler’s Fallacy by visualising it in MicroStrategy.
Going further
There’s science and reason, and then there’s faith and hope. What I have there is a fine system to store and analyse draws. I have thought of ways to enhance this:
- Scrape the source site every week to automatically update the dataset.
- Use Python and mstr.io to implement various pseudoscience algorithms (Numerology, horoscopes) to pick auspicious number sets.
- Analyse patterns based on the sum of all numbers, or the intervals between them.
- Track the machines and ball sets used, and also the draw sequence of each ball. See if a bias emerges…
To close, I’d say the fun of doing all this in MicroStrategy mitigates the disappointment of forever not winning the jackpot.

You must be logged in to post a comment.