
The Premise
Crime is an emotional subject. It is constantly being mentioned in the media, more or less stridently depending on the publication, and more or less correctly. As a “citizen data scientist” (actually someone who needs to go the gym but prefers mucking about with data), it is always my desire to verify what the media, and the politicians, have to say about the subject.
For this study, the task is made possible by the Home Office publishing crime statistics on a monthly basis, by police authority and down to local level.
You can get hold of this data here:
The purpose of this article is multifold:
First, it aims to demonstrate how a tool such as MicroStrategy can be used to bring to life data about a given subject. Other tools exist, but as I have stated in previous articles, I work for MicroStrategy and I am unashamedly confident both in the abilities of the software and my competence with it.
Second, I am using the output of the first premise above to answer some initial questions: What does crime look like in the major towns of the Home Counties ? Does the data correlate with what I know of the towns ? What sort of crime is prevalent outside of urban areas ? What are the outcomes of police investigations into the crime, which area and which crime types have the best resolution rate ?
Third, can the output of previous two premises be used to build a compelling story that could be published in its own right ?
That’s the scope of my current investigation. However, I can already see ways of transforming this exploration into a powerful tool, given the right investment.
For instance, what enrichments could be possible to put the data in context in terms of deprivation, population densities, political prevalence and ethnic composition ?
Finally, and that is the true prize for me, will I be able to build, once I have upgraded my system to 2019.2, (eventually, I keep being distracted) a HyperIntelligence capability which will provide me with a pertinent summary about a given location in the Home Counties whenever they pop up in my Chrome browser ? Will I be able to use the Police API to keep the data fresh, and will I be able to scale up my solution so that it covers the entire country ?
About the Data
Getting hold of it
The link at the start of this article will take you to the initial download page. You can download all of the data, however this is a colossal amount and it would take a great effort to get it all in a shape ready for investigation.
The site helpfully provides a query tool permitting the download for a range of months and police authorities:
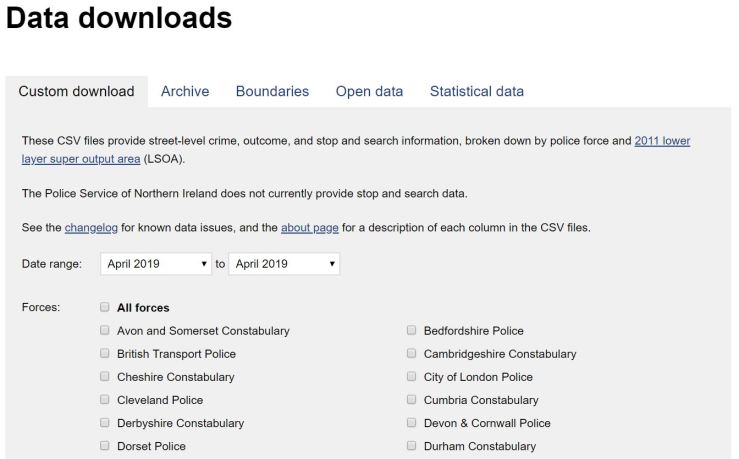
For this article, I have selected a year’s data from February 2018 to February 2019, for the Thames Valley, Bedfordshire and Hertfordshire police areas.
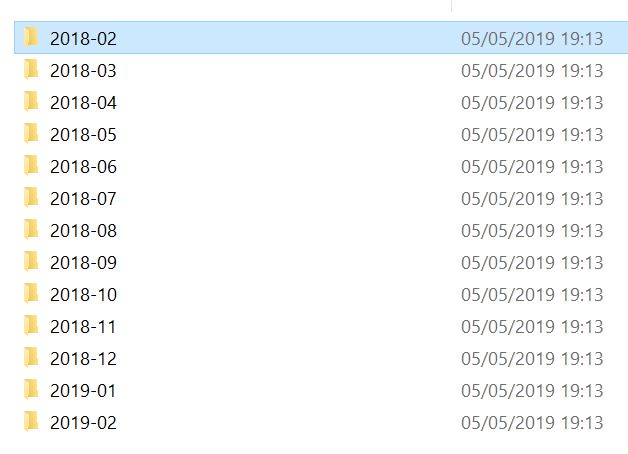
This utility will then squirt a zipped folder to your Download area, which you can unzip into a location of your choice. Your downloaded data will be structured thus:
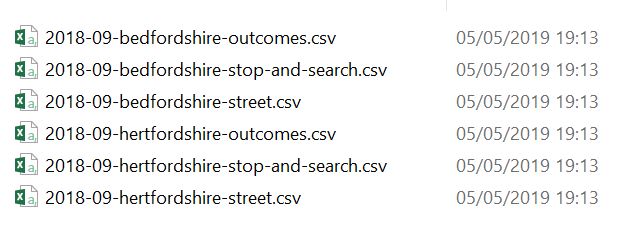
Each folder contains these files:
Looking at one of the files via Excel:
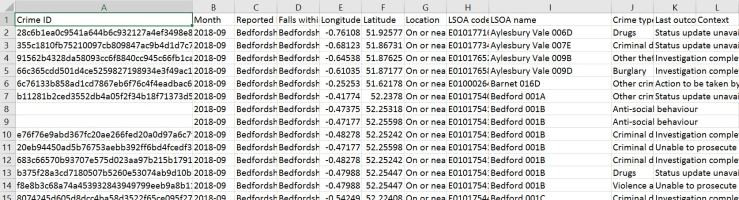
We note some interesting features. We have longitude and latitude that plots the rough area where the crime took place. The data is anonymised so the precise location is not given. We have the LSOA code, which is a census geographical area representing roughly 1000 people. We have the month, and we have a crime ID. You will notice that some crime IDs are null – these lines represent Anti Social Behaviour Orders, which are classified and resolved differently. These nulls can prove troublesome when we manipulate the data, so we’ll need to do something about it.
Staging the data
You’ll have noticed that our data is delivered in pieces – we have one csv per month and police area. We could load these chunk by chunk into a MicroStrategy cube, however this would prove to be cumbersome and lengthy. In addition, we want to future-proof our efforts so that our data can be manipulated and enriched in later stages.
So for this exercise, I have imported the data into a MySQL database. In there, the data structure looks like this:
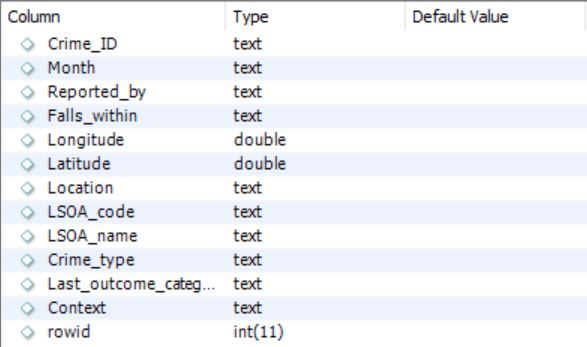
Now that our data is all neat (well, almost) and tidy in a MySQL table we can point MicroStrategy to it and import it into a cube:

And in due course, we have a cube upon which we can build a dossier.

That’s a great place to start exploring the data and to get a feel for the sort of visualisations that will tell the best stories.
However, in its current form, there are a number of useful data features missing which would help greatly with the investigation that I require. I need:
- To group all the LSOAs for the towns that I want to compare. I can create a group in my dossier, and this can help me work out how the grouping will work.
- To count the total number of crimes by LSOA, crime category and month and have this as a discrete number ( This will be a level metric).
- To work out the percentages of the outcome within the Crime category.
- To only have the data in the cube for the towns I require.
I can do all this in a dossier as those features are supported. However, this all represents a fair amount of analytical processing – if I add the use of maps in there, this makes the dossier not as fast as I would like.
That’s fine, because it’s a necessary step on the path from exploration to exploitation:
You start with a broad view of the data, you experiment, you work out the items you need and then you work on trimming down the solution so that the outcome is blisteringly fast. This way, we make sure that when we go to production, we have an efficient application that can scale to many, many users, and we provide each user a pleasant experience with a responsive offering.
I’ll spare you the modifications I made to my database, the elaboration of the schema and the level metrics – thanks to the initial exploration via the data import and the test dossier, I knew what results to expect. This saved me quite a bit of time.
I ended up with a schema cube that builds everything I need in a matter of minutes:

And a test report that validated the level metrics and the aggregations:
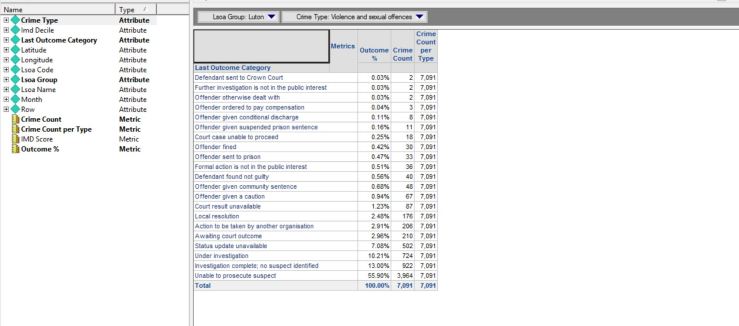
As you can see in the above screenshot, I now have an attribute for the LSOA groups allowing me to select aggregate values for the towns I want to investigate. I also have the level and compound metrics that give me, by crime category, the percentage for the outcomes.
In passing, I notice that only a tiny proportion of reported crime results in the perpetrator being punished. This varies by crime type, but not by much. This needs investigating !
I’m now ready to start the second phase of the exploration, able to slice and dice with a much sharpened knife. And this is a good point to conclude this first part. Time permitting, I shall write the second part in the next few weeks.
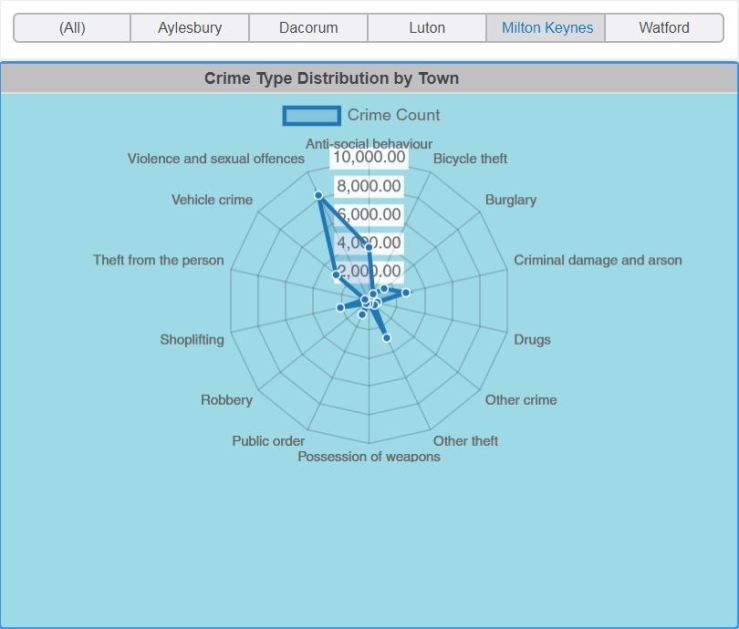
Thanks for reading this far ! And here’s a teaser from my freshly minted cube:
And if you’re lucky, I might even make a video.

[…] The first offering will be a demo of MicroStrategy’s HyperIntelligence, leading into an exploration of Crime in the Home Counties – see Crime in the Home Counties: A data discovery journey – Part 1. […]
LikeLike