
Do you remember this map:
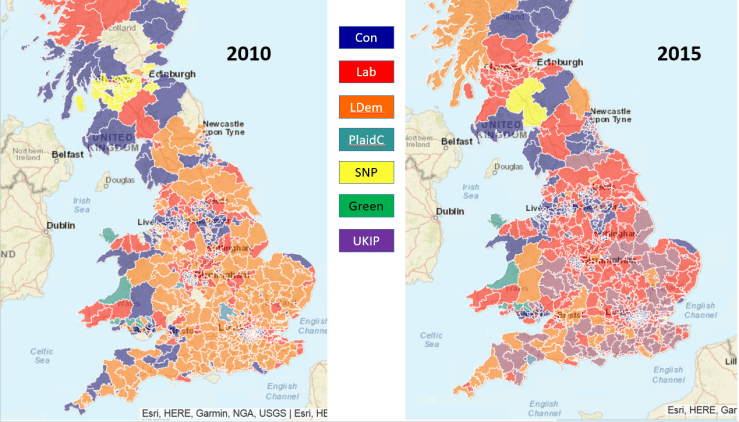
A study was made of which party came second in the 2015 UK General Election. This was described in this post: Election 2017: Context with maps.
I’ve been meaning to repeat this exercise for a while because I was curious to see if UKIP was still the runner-up in the 2017, post-referendum election.
So I got hold of the requisite dataset from the Electoral Commission which was in a perfect format so imported into a cube without difficulty. The dataset looks like this:
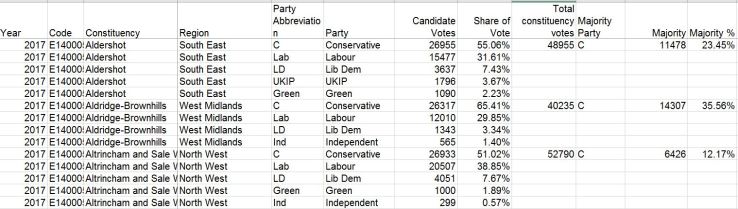
Once in a cube, it’s a simple matter to create a ranking metric based on Candidate Votes which can then be used to select, for all constituencies, the 1st, 2nd, 3rd and so on party.
A slightly more convoluted method to achieve the colour-coding for each constituency on the map, as the advanced threshold is not available when using ESRI maps. So a metric using a CASE statement provides a numeric value for each party, which is then used as a threshold to provide the correct colour.
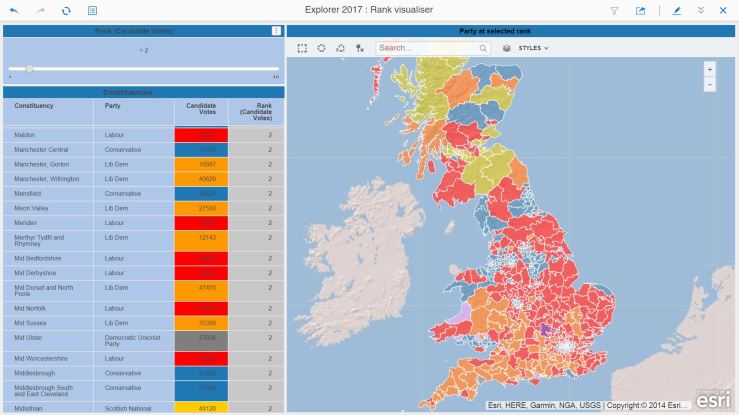
Here’s the map of the election winners:
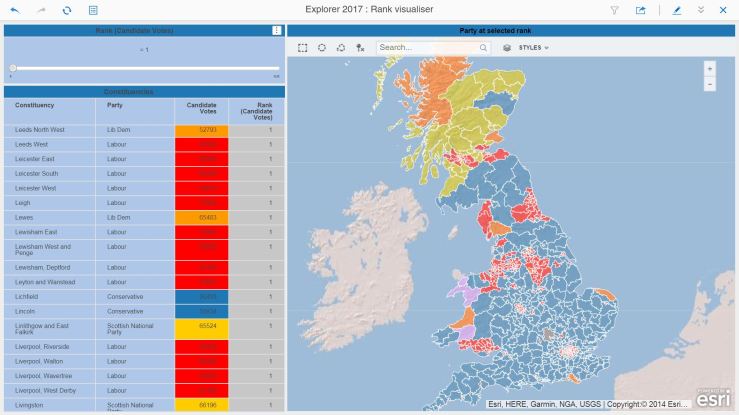
Let’s take a look at the South East:
In 2015, UKIP came second in many constituencies. Will this be the case in 2017 ?
With, again, a look at the South East:

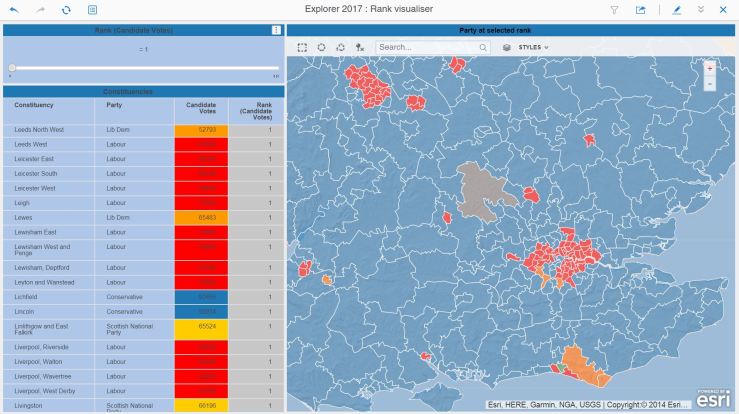
When looking at who came third, UKIP makes an appearance in the Thames Estuary constituencies. To avoid tedium, we’ll show below some maps for the fourth ranking:
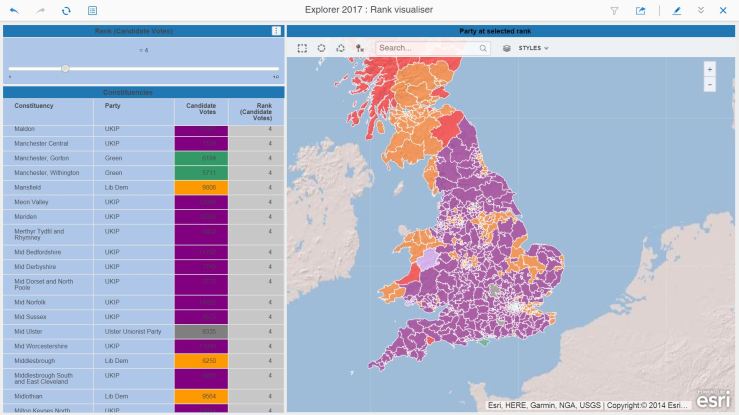
Many of the rural constituencies have placed UKIP in fourth place. An interesting pheomenon occurs when you look at the cities:
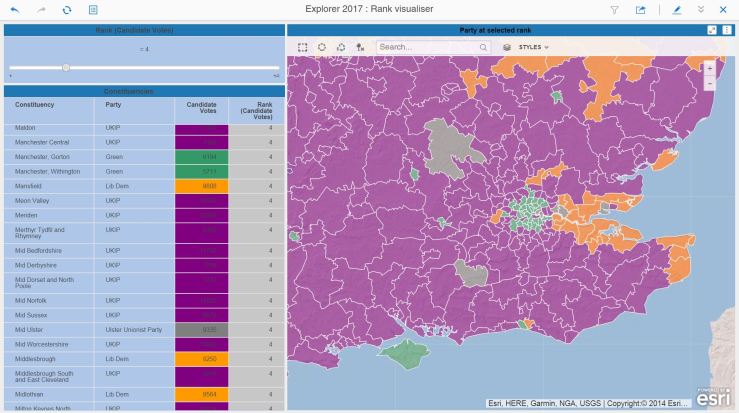
In a sea of purple UKIP, the cities stand out like beacons with their ranking of the Greens in fourth place.
So here you have it. UKIP recedes in the electoral consciousness post-referendum, with the traditional parties positioning themselves on city vs country and north/north-east vs south-east/south-west lines.
If only time permitted, we could enrich this with the candidate information, show the gaps between winner and loser to identify volatile constituencies and layer on top some local data to assess what issues might resonate locally. We could then look at focusing a party’s messages based on local priorities, hopefully resulting in increased votes. It’s totally possible and I have the data. I am just short of time…

You must be logged in to post a comment.